We write a great deal about the aging of America. On any given day, about 10,000 boomers turn 65 and opt to leave the workforce, change roles in society or simply retire. As we considered this fact, we wanted to look at a map of age distribution across America. Fortunately, Census.gov has a nice map updated as of July 1, 2021.
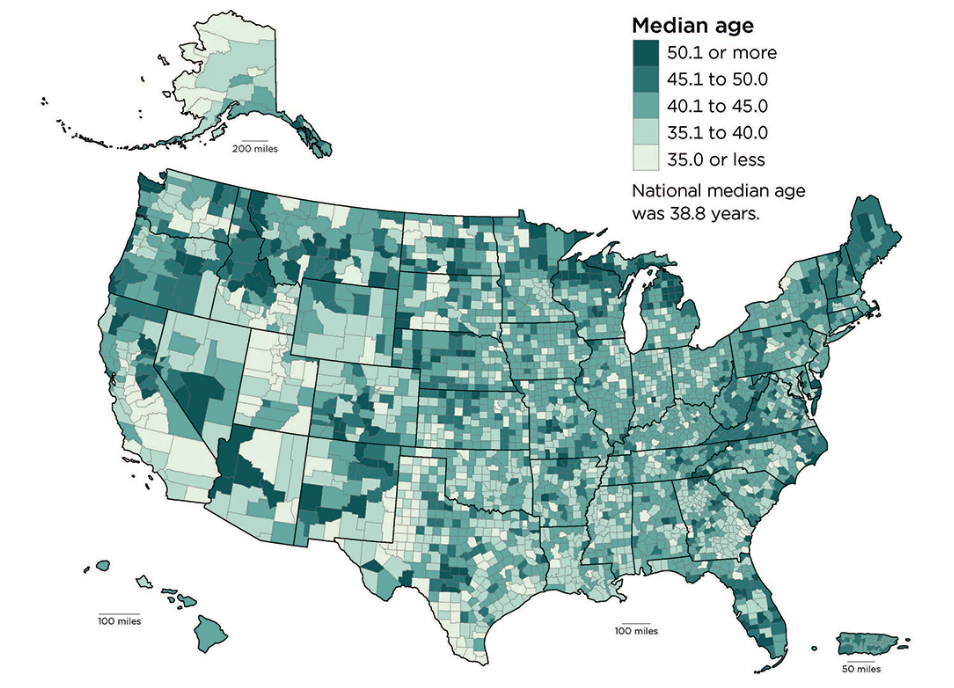
As the map reveals, the northeast is top heavy people over the age of 50 followed all the way down the east coast to Florida. Idaho and the pacific northwest has another cluster of 50+ people. The youngest populations are primarily in the southwest from Texas to California..
We’re doing some analysis on what it will mean for health care services and availability of medical care in these areas. It is interesting to note that many of the 50+ age clusters are in rural or semi-rural areas where there this limited health care services.
We’ll continue our analysis but in the meantime, stay tuned and stay solvent.