With the whopping 9.1 inflation report yesterday, we decided to take a look and try to figure out how long inflation may be here to stay. Fortunately, Finance Yahoo had an interactive chart of the inflation periods since 1970 so we decided to take a look and came up with our on snapshot.
Our rudimentary analysis shows some key inflationary periods in the United States. Here is our breakdown.
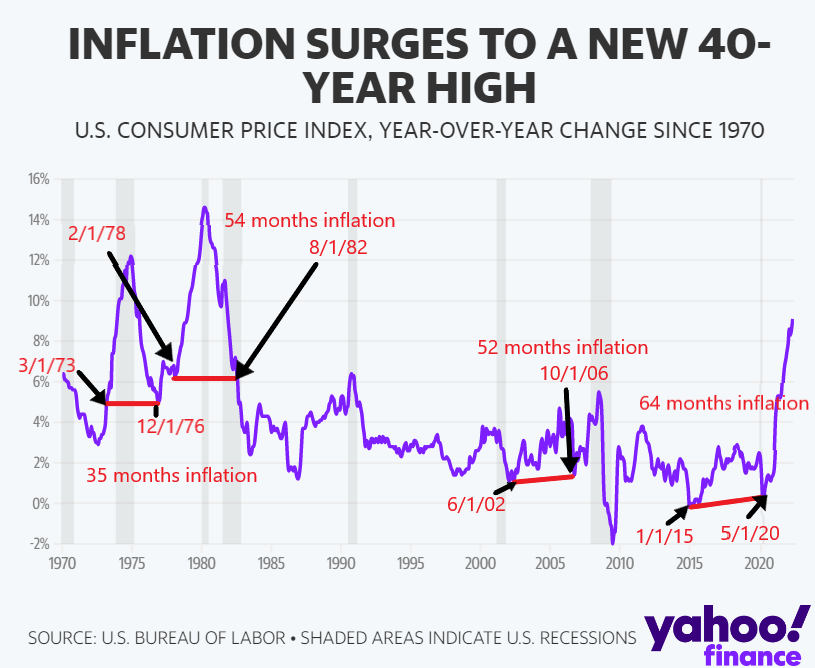
From 3/1/73 to 12/1/76, inflation took 35 months to go through a cycle.
From 2/1/78 to 8/1/82, inflation took 54 months to go through a cycle.
From 6/1/02 to 10/1/06 inflation took 52 months to go through a cycle.
From 1/1/15 to 5/1/20 inflation took 64 months to go through a cycle.
From the data above, on average it takes 51 months to finish a cycle of high inflation but the shortest time frame was 35 months and the longest was 64 months.
Keep in mind that during these inflationary periods, interest rates were way above 7% and we’re only at 1.75% right now! If history holds then we’re in for high inflation up until sometime in October 2026!
If inflation remains high for the next 51 months then a prudent investor needs to do everything to address the upcoming inflation apocalypse. The best thing to do right now is to stay tuned and stay solvent…