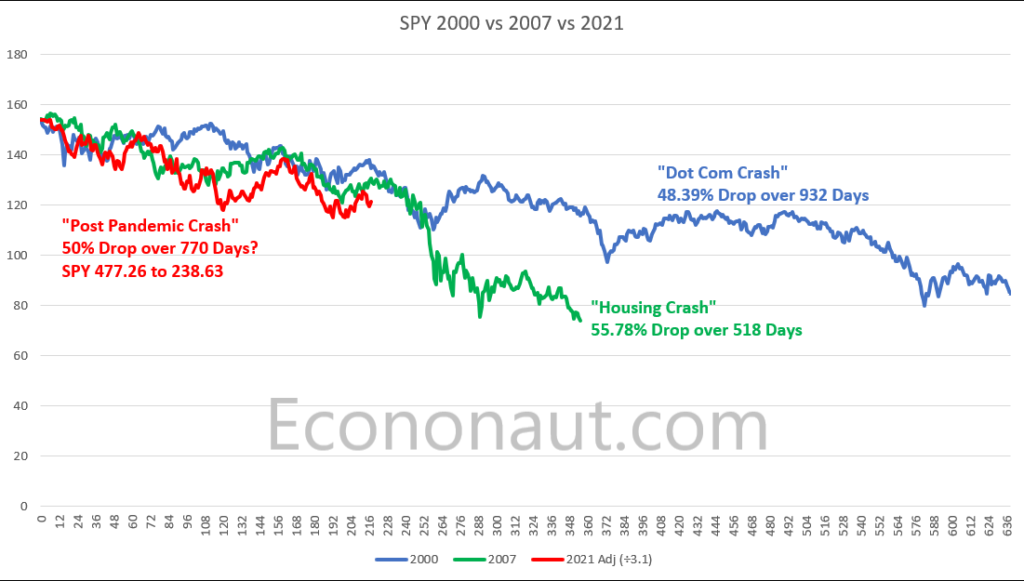
We like to periodically check the current declines in QQQ & SPY to previous steep declines such as those that occurred during the ‘dot com’ and ‘housing’ crashes so let’s take a look at some charts:
We are 217 trading days into the SPY crash comparison from prior crashes. Depending on the comparison we are either 1/3 of the way through a ‘dot com’ crash or we are 2/3 of the way into a ‘housing’ crash scenario. Ironically, we may end up being in a dual ‘dot com+housing’ crash given what is happening with tech and housing meltdowns!
We are 239 trading days into the QQQ crash comparison from prior crashes. The chart below suggests we are either 2/3 of the way into a ‘housing’ crash or about 1/2 of the way into a ‘dot com’ crash however with the Fed continuing to raise rates, we may be in for some steeper declines soon.

In prior crashes, both SPY and QQQ crashes took 630 trading days to complete and we are only in the 200’s trading days so I’d say we are about 1/3 into both crashes at this point but anything is possible.
Over the next couple of days we will be looking at some potential investment opportunities we’ve been tracking but in the meantime stay tuned and stay solvent…