The Fed decided to pause on rate changes yesterday and that got us thinking about our post entitled, “Comparing Inflation 1960 to 2023” and wondering if its Déjà vu all over again. Let’s take a look at those charts again:
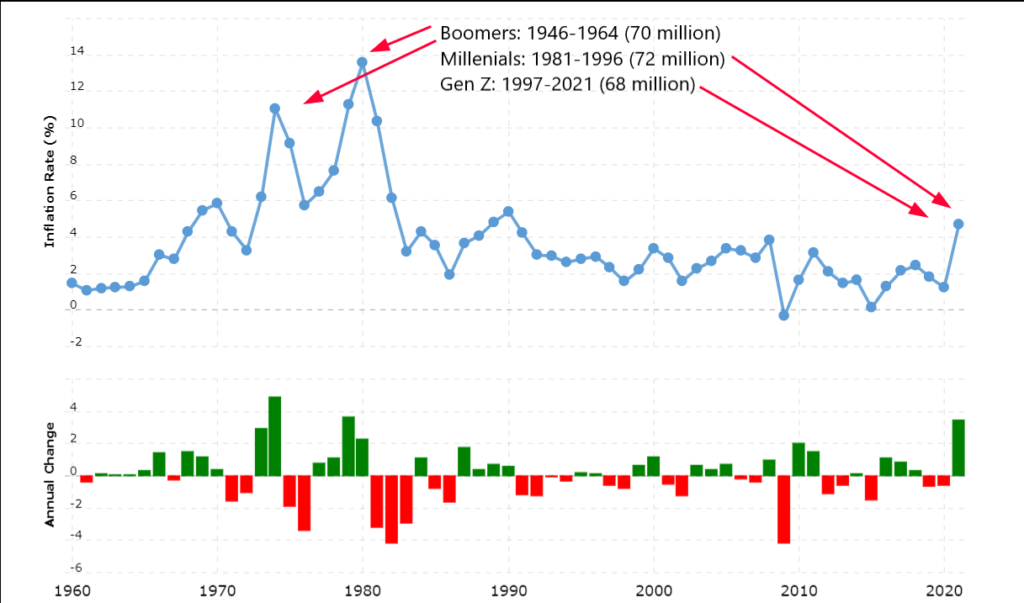
The chart above represents our demographic thesis. In the 1960’s baby boomers, 70 million strong cohort, were coming into family formation age and drove demand for houses, cars, jobs, and other goods and services through the roof leading to high inflation. The high inflationary period of the late 70s was exacerbated by the OPEC oil embargo. In 2023, we now have millenials and and zoomers entering family formation age driving demand for housing and other goods and services. COVID and supply chain problems helped drive inflation through the roof.
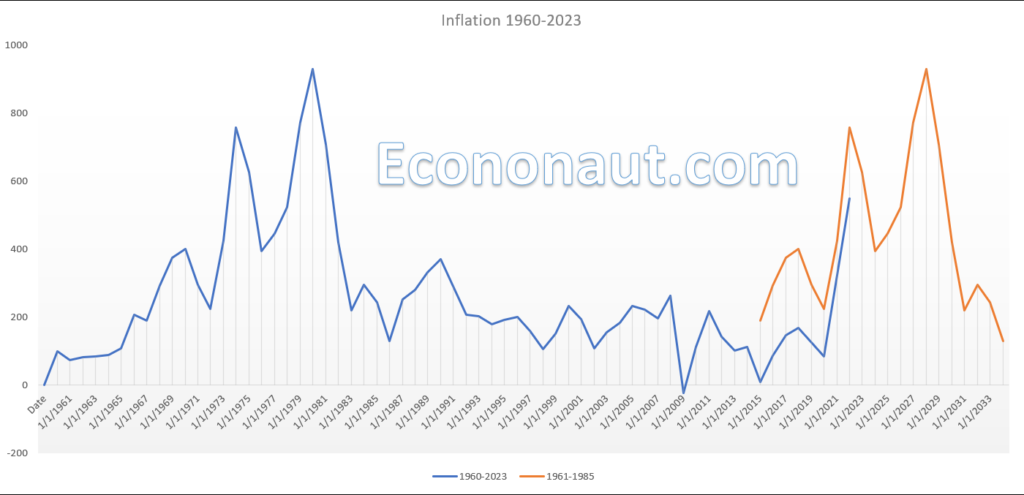
We overlaid the inflation chart from the 60s thru 70s and extended it out into the 2015 to 2030 period. Does the pattern look similar? Oddly enough, the central bank thought they had tamed inflation so took the pedal off the gas only to have inflation re-surge with a vengeance a few years later.
The Fed seems poised to take the pedal off the gas in 2024 and start cutting rates because they think inflation has been contained. It’s Déjà vu all over again. If history repeats we will see inflation surge again sometime in 2027 or late 2026 with the next couple of years being a good time to take advantage of cheaper prices.
We continue to invest in T-Bills and our TLT trade has been doing very well. If the inflation paradigm holds, we may want to sell off TLT in mid to late 2025 but to find out the exact time frame stay tuned, stay profitable and stay solvent…