We already have put options on XHB and wanted to take a closer look at three key home builders: Toll Brothers; DR Horton and Lennar. Specifically, we wanted to compare the 2005-2009 stock declines to what *might* happen if things continue to deteriorate. Let’s take a look.
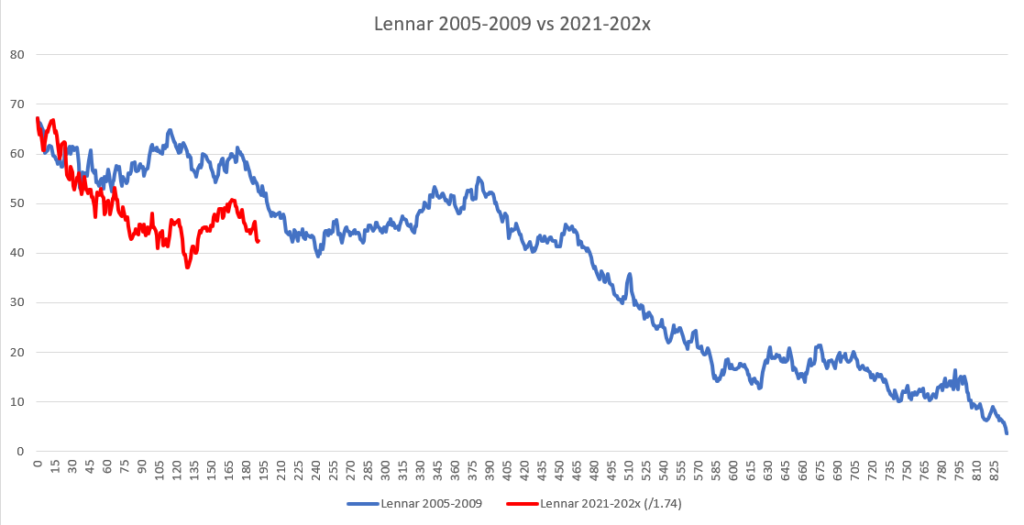
Lennar stock price (when adjusted) has been deteriorating at a much faster pace in 2021 than it did in 2005. It took Lennar 825 trading days to go from peak to low starting in 2005 and ending in 2009.

Next up is DR Horton (price adjusted) which also decline at a much faster rate in 2021 than it did in 2005 to 2009. It took a total of 812 days for DR Horton to go from peak to low.

Lastly, Toll Brothers seems to perfectly match the decline from 2005 in 2021. If the trend holds then we can expect a decline of Toll Brothers all the way down to about half of it’s peak value over the next 913 days.

And lastly, here’s the chart of XHB which took 728 trading days to go from peak to low.
We’ll keep an eye on these three home builders and track our models. In the meantime stay tuned and stay solvent…