Yesterday we wrote about the great upcoming opportunities to snap up dividend stocks at deep discounted prices but when to buy? We wanted to baseline three popular dividend ETFs: HDV, SCHD, DIVO but these only go back to 2011.
We decided to do our baseline on a popular Vanguard fund VYM and gathered data from the 2007-2009 recession period to today.
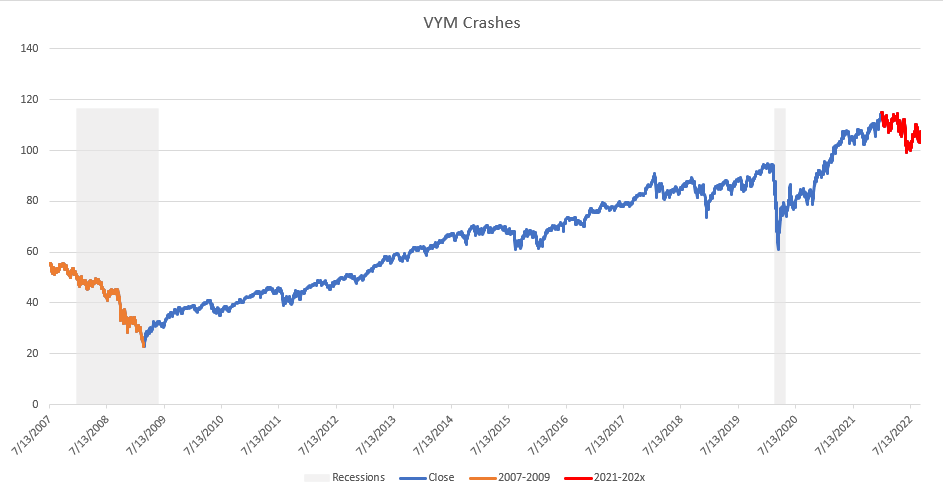
The chart tracks VYM from 2007 to 2022 and the gray bars denote recession periods. When we compare the 2007-2009 period to 2021-202x, we get the following chart.
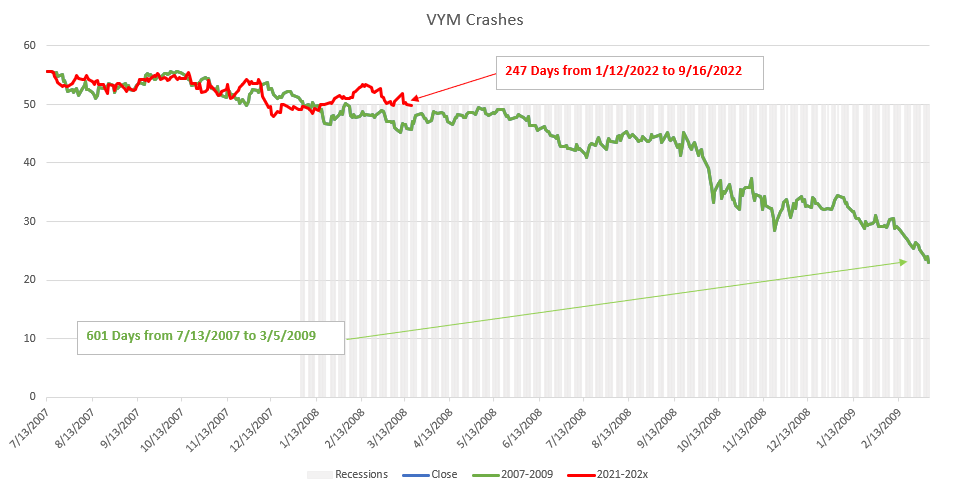
The 2007-2009 VYM correction/decline took 601 days from peak to low. If we assume that 1/12/2022 was the peak and it will take a similar time frame to correct then we have 353 trading days to go or about 16 months or around January 2024.
As always, these charts and research are for our purposes only and should not be used to make any investment decisions so stay tuned and stay solvent.