We’ve been plotting the progress of the slow motion crashes in SPY, QQQ and XHB for some time now. It is a bit eerie how the charts tend to follow previous crashes although not entirely on the same time frame. Let’s take a look at SPY crashes from 2000 vs 2007 vs 2021.

SPY seems to be following the trends from the last two crashes. Indexes don’t fall off in a straight line but a gradual slow decline with plenty of bear rallies as things continue to glide down and we expect the down trend to continue in 2023. Let’s take a look at QQQ.

The QQQ crash seems to be following the housing crash 2007 pattern far more than the dot com crash of 2000. This would make sense since the housing crash tangentially affected tech whereas the dot com bubble burst directly affected tech stocks.
Let’s take a look at XHB.
Note that when XHB crashed, there were plenty of bear rallies and today’s crash pattern is closely following the crash pattern from 2007. In 2007 there was a steep drop then a recovery followed by a recovery then a longer drop. In 2021 we started with a steep drop followed by a bear rally longer drop. In both situations there was a smaller rally afterwards before the long trend down.

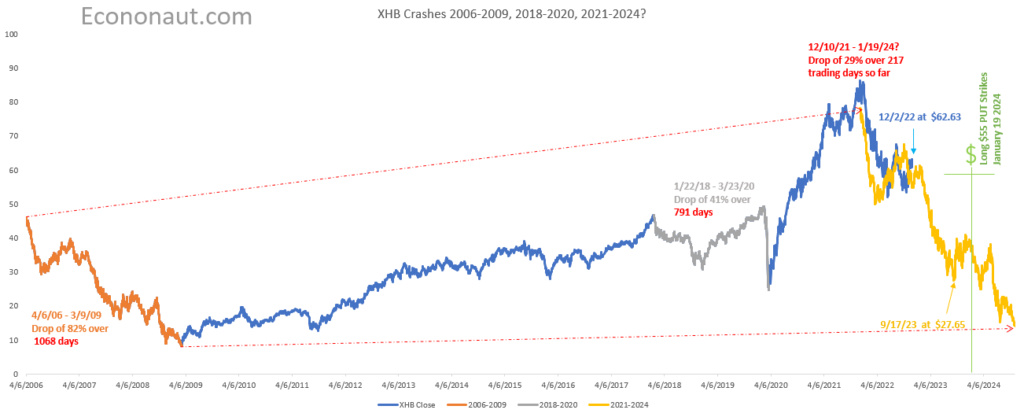
On this final chart, we took the 2007 crash (orange line) and “projected” it into the future (yellow line) to see how closely the 2007 housing crash will map to the 2021 housing crash. So far the pattern are eerily similar complete with bear rallies in between the drops.
As a final note, we have PUT option positions for January 19 2024 $55 strikes. We have periodically added to those put options every time XHB has rallied and will continue to do so but we feel confident XHB will likely drop below $55 by January 2024.