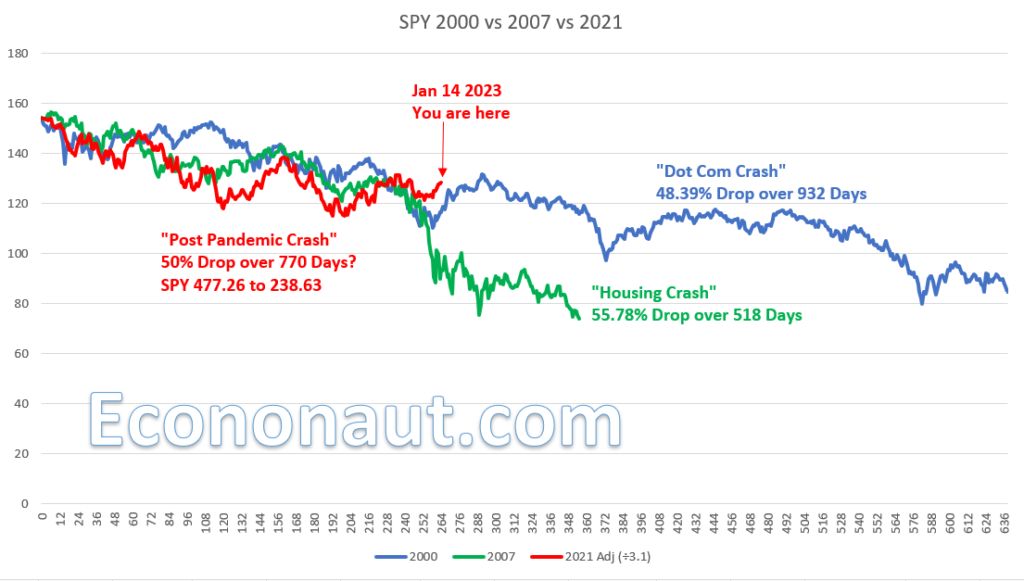
We’ve completed the first two weeks of 2023 so let’s take a look at where we are with our crash comparison charts.
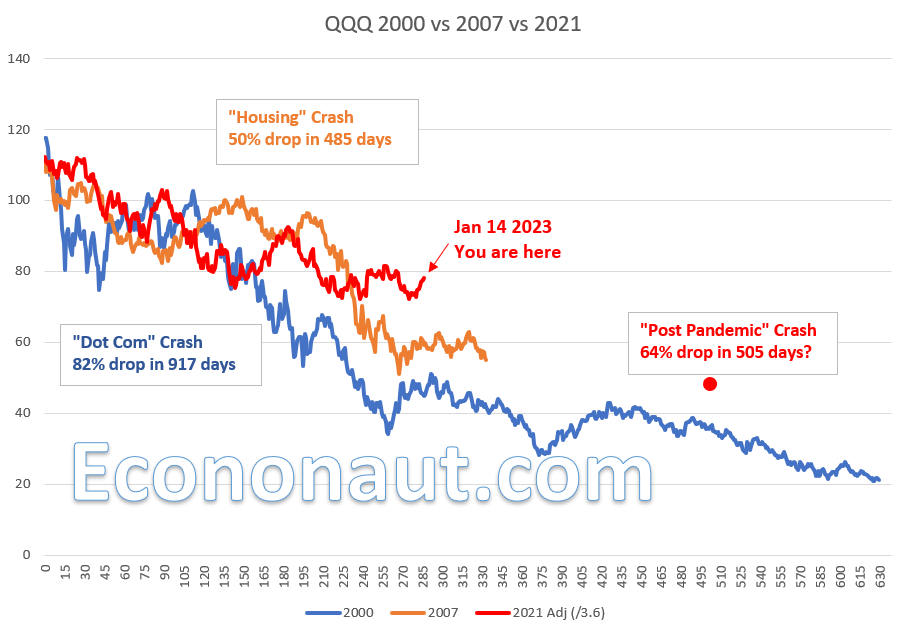
What about QQQ:
And finally XHB:
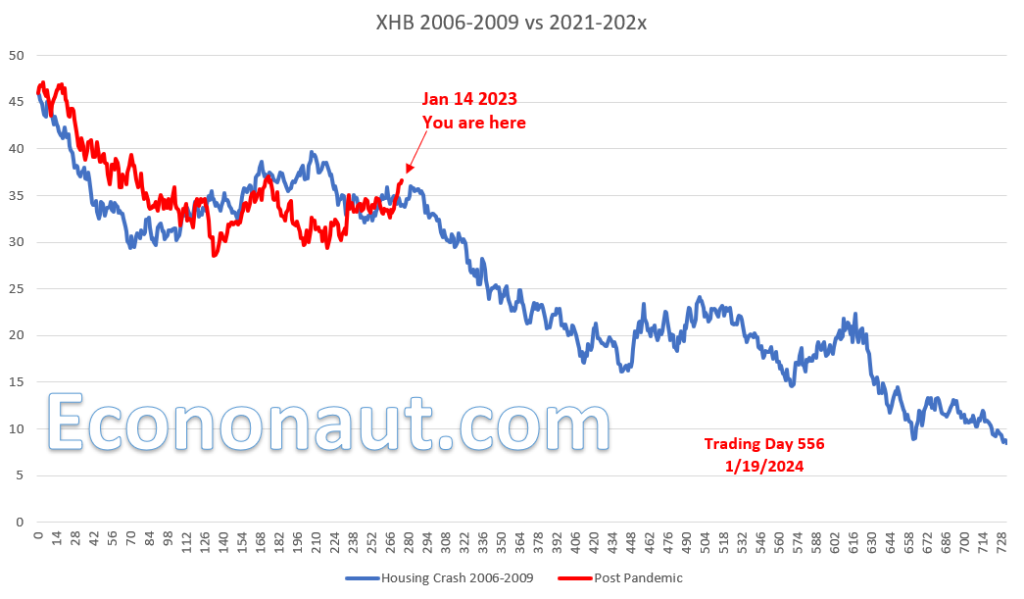
Interestingly, XHB is following a very comparative pattern and if the pattern holds, we will be heading down the next leg over the next 365 days. As a reminder, we hold XHB $55 PUT contracts and have been buying more during rallies.
Stay tuned, stay profitable and stay solvent…