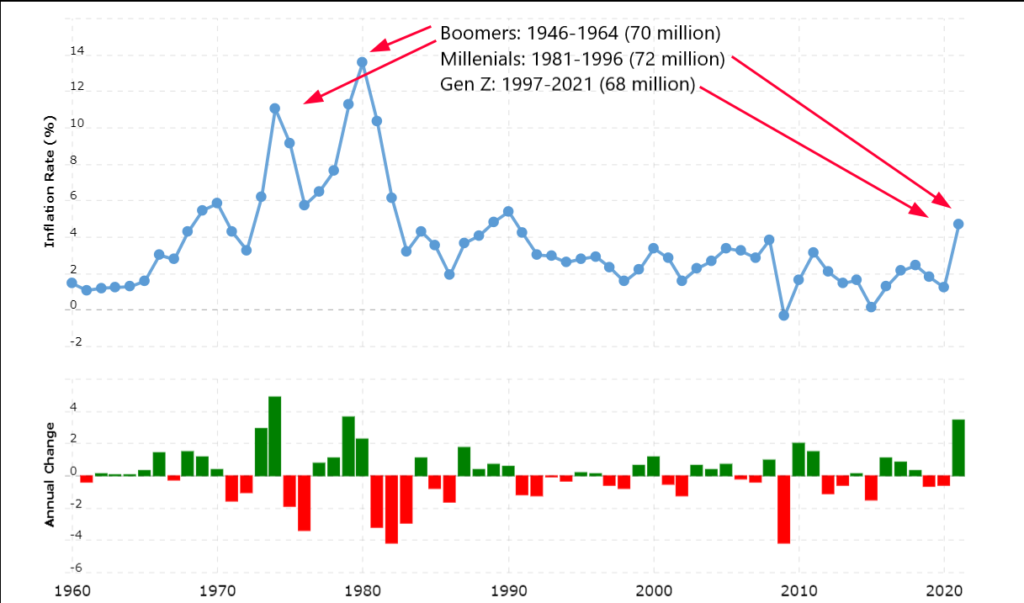
In our post, Fed Pause, Demographics and Inflation we showed the chart below that showed how millenials and gen z are now a huge demographic coming into family formation and putting pressure on housing and other goods and services.
We wanted to dive deeper into this phenomenon so we dug up some inflation data from the St. Louis Fed and mapped the 1970s inflation to where we may be headed in 2023.
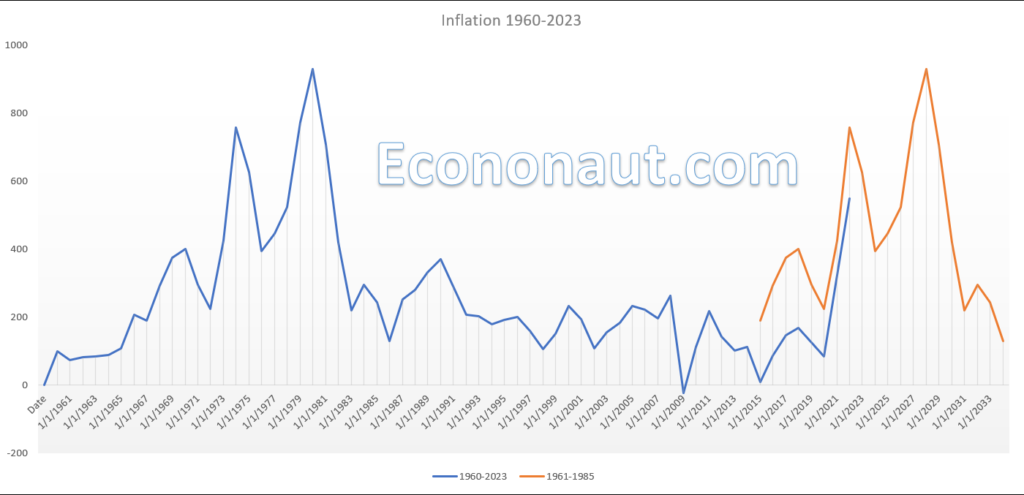
As you can see from the chart, the yellow line shows what inflation could look like if it followed the same pattern as 1970’s and it currently shows an eerie similarity. We went further and then mapped the Fed Funds rate as well to understand where the Fed may be forced to go if inflation continues to climb.
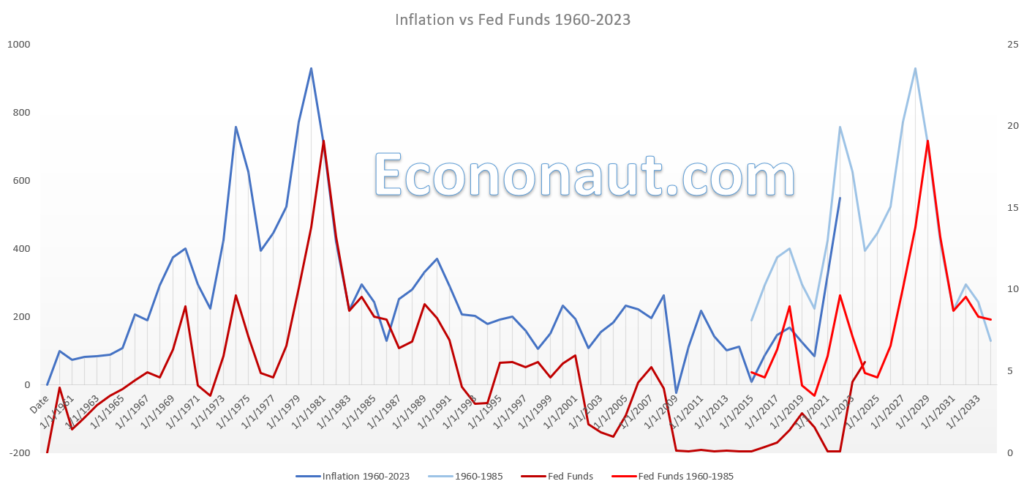
While this chart is a bit busy, we tried to keep the colors consistent. The light blue line shows where inflation might go based on 1970’s historical data and the light red line shows where the Fed may go if history repeats.
How does demographics play into these scenarios? As millions of boomers go off to retire they need their homes to live in but we also have millenials and gen z generation coming into family formation age and needing to buy either their first home or larger homes for expanding families.
There is pressure from all generations for more goods and services at a time we have a challenging trade relationship with China, a growing war in the Middle East that may impact oil production & distribution and a depleting labor force as millions of people in the U.S. retire.
The best we can do is start to position and plan for a variety of scenarios such as:
- The Fed, in raising rates too aggressively, breaks something such as massive cascading defaults. In this scenario, the Fed will be forced to do emergency rate cuts and bond prices will spike which is why we’ve been nibbling on TLT.
- Inflation, with the Fed being too lax on interest rates, has a mega flare of inflation in the same fashion as the 1970’s. This scenario is highly plausible with the situation in the Middle East at the moment. The Fed will be forced to drive interest rates sky high which would cause bond prices and to crash further. In this scenario we will continue with what we have been doing and buy more short term T-Bills and profit from the spike in short term interest rates.
- In either scenario, we don’t see how stocks can rally because high inflation means higher costs and wages to businesses and will result in lower profits. If the Fed breaks something and defaults cascade, stocks won’t be unaffected either. The way we are approaching our stock strategy is using the DIVOS™ strategy.
It’s a difficult and exciting time to invest right now. One thing is certain, there will be a great deal of volatility and it’s usually the best time to sell covered calls and naked puts so stay tuned, stay profitable and stay solvent…
[…] “Comparing Inflation 1960 to 2023” we demonstrated how inflation is following an eerily similar path as it did in the late 70s […]