We picked up some more Cisco Systems (CSCO) stock today. Cisco was one of the few stocks that has remained relatively stable compared to other tech stocks. We wanted to take a look at the last five years of stock data and figure out where we stand today.
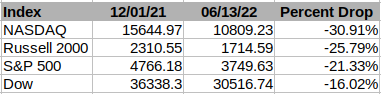
From our review of the major indexes over the past five years, we noted that the indexes peaked in December 1, 2021 except for the Russell 2000 which peaked in June 1, 2021. As of June 13, 2022 the index that has dropped the most percentage wise has been the NASDAQ at a drop of nearly 31 percent since the peak. An enterprising investor would start their research with the NASDAQ index to look for bargains and work their way down to the other indexes.
One stock that is leading the decline in the NASDAQ is Apple. The peak for Apple was December 1, 2021 at $177.57 and as of June 13 close it was $131.88. This represents a 25.73 percent drop in Apple stock. For Cisco Systems, the stock peaked on December 1, 2021 at $63.37 and closed at $43.24 on June 13 representing a drop of 31.77 percent.
Between the two stocks, Apple and Cisco, we opted to buy more Cisco given that it has a solid dividend and a great valuation discount at the moment. If Cisco drops some more, we may buy more as we plan on holding this stock long term.
The Fed’s FOMC meeting will let us know where interest rates are heading later this week. The only thing we expect is more volatility and corrections. It is prudent to stay tuned and stay solvent…