As we mentioned before, we like to navigate the financial markets through a variety of lenses and we decided to take a trip down memory lane all the way back to our early school days and re-visit algebra along with previous stock market crashes. We chose the “dot com” and “housing” crashes because those two crashes were based on malinvestment, fraud and greed which are three key conditions we’ve had during the post pandemic market run up.
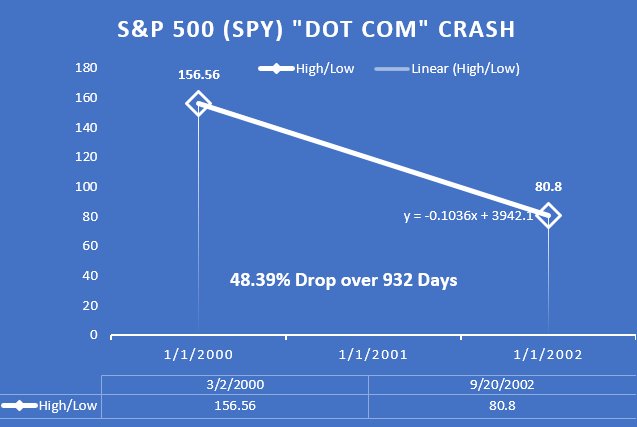
First we took a look at how the S&P 500 behaved during the “dot com” crash. This particular malfeasance event took 932 days to cleanse itself and resulted in a drop of 48.39 percent which began at a peak on March 2, 2000 that lasted thru September 20, 2002.
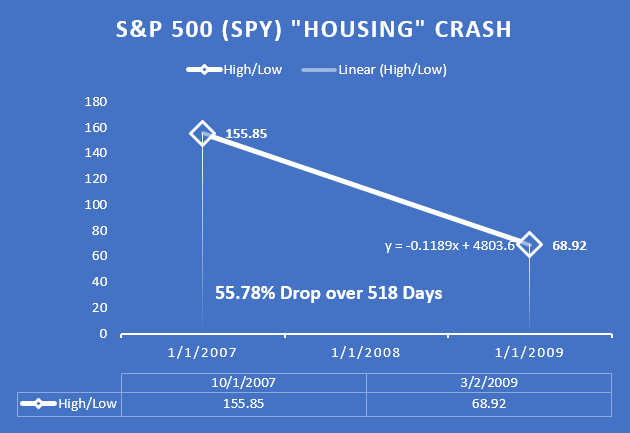
Second, we took at look at the “housing” crash in 2007 to 2009. This malfeasance event took 518 days to drop and began on a peak of October 1, 2007 down thru March 2, 2009 and resulted in a 55.78% drop in the S&P 500. This event only completed because the Federal Reserve lowered the Fed Funds rate down to zero percent for a long time.
And last, we try to project what a “post pandemic” crash might be under the right circumstances after completing the third malfeasance event of rent/mortgage moratoriums, PPP funds, and other giveaways. Unfortunately, the Fed is now facing massive inflation and can’t easily lower rates without letting inflation run rampant so based on that information and projections from prior crashes we came to the conclusion that the next market correction can last up to 1831 days (5 years) and result in a correction of 55.79 percent. The “bottom” for the S&P 500 won’t occur, in theory, until late 2026 or early 2027 but there will be a slow burn down to that level with periodic rallies and corrections.

The good news is bond rates may recover so we’re looking at viable bond investments now. Stay tuned and stay solvent…
[…] we mentioned in our post, Algebra and the Post Pandemic Crash, we like to take a look at investment opportunities through different perspectives. Our data feeds […]