

The September inflation scoreboard is in, and it’s not pretty. Across the trading partner landscape, consumer prices pushed higher almost everywhere — driven by a familiar villain: energy costs. The US led the developed-world pack at 3.7%, while India topped the charts at a blistering 5.54%. China, once again, is the lone outlier at just 0.9% — still flirting with deflation as the rest of the world burns fuel and pays for it.
This monthly check-in compares annual CPI inflation across America’s nine largest trading partners. It’s not just an academic exercise — inflation differentials directly affect who has the pricing power, whose currency strengthens, and whose exports get priced out of global markets.
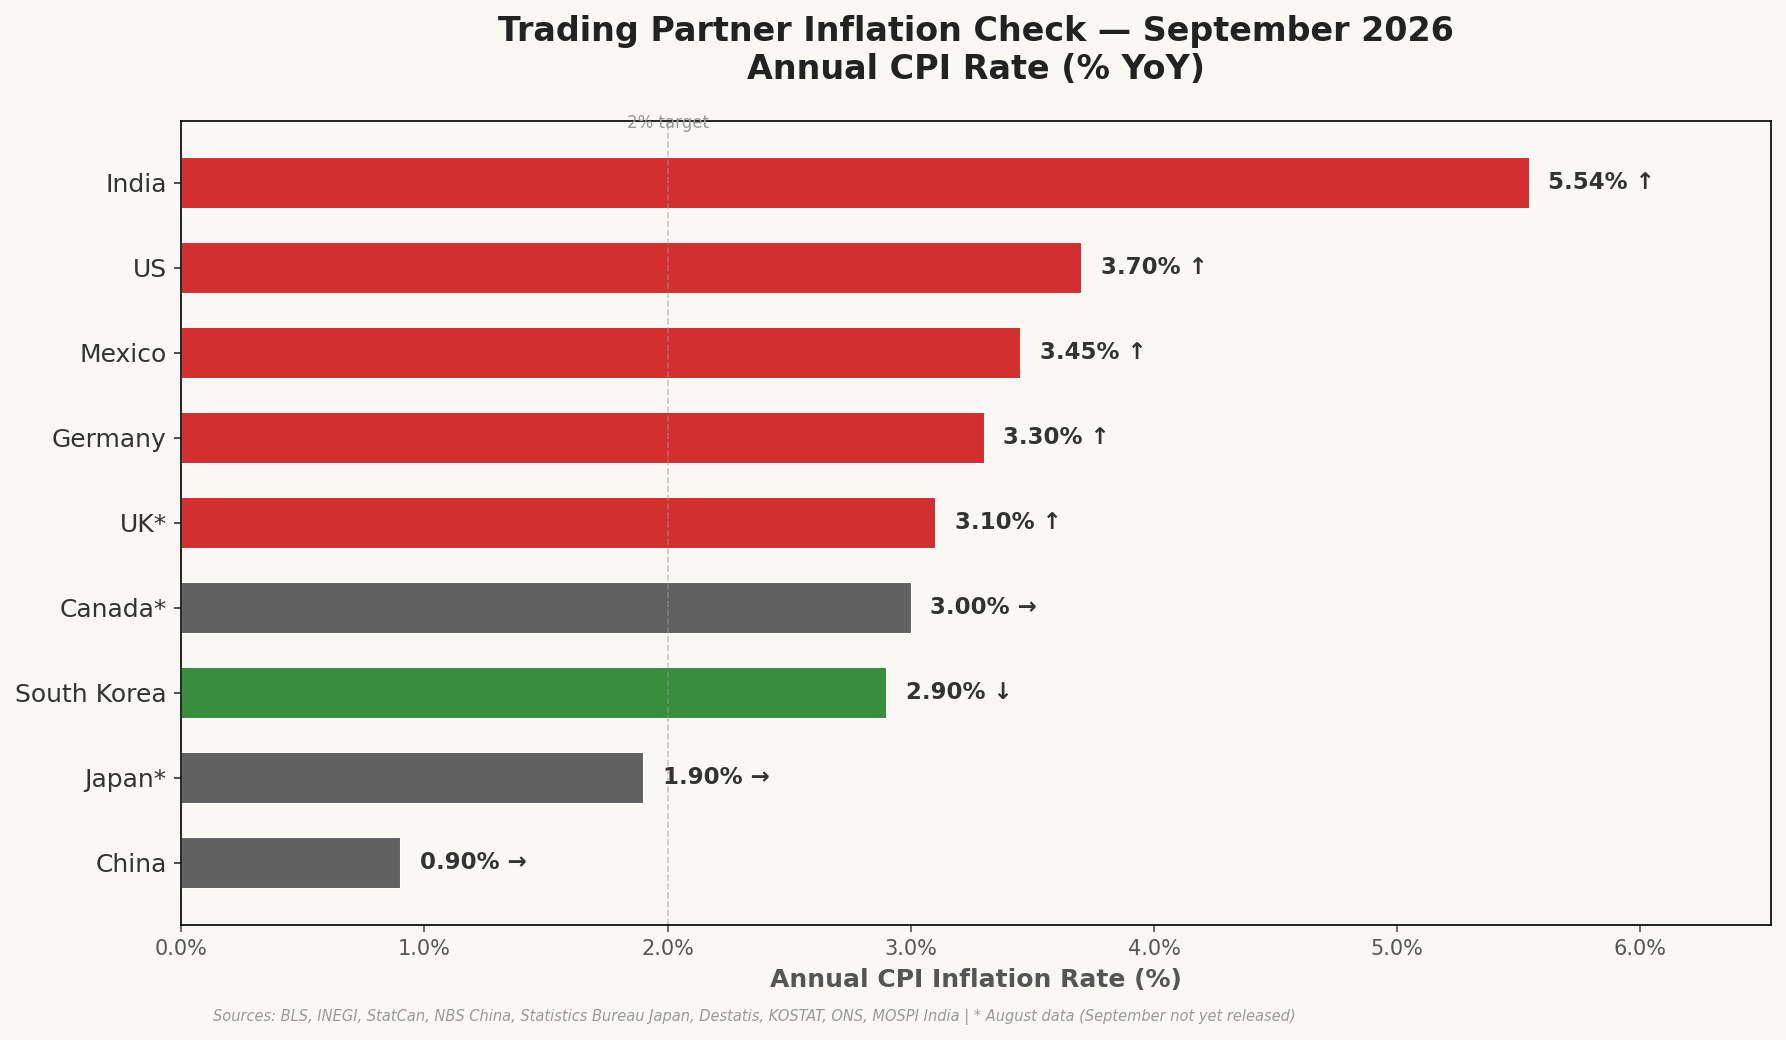
The Scoreboard
Here’s where things stand, ranked highest to lowest:
- India — 5.54% (up from 4.83%): A staggering jump. Food inflation hit 7.74%, and this is the fourth straight month above the RBI’s 4% target. The central bank is running out of room to stay dovish.
- United States — 3.7% (up from 3.4%): Gasoline alone accounted for over half the monthly increase. Core CPI ticked up to 2.6%, defying expectations it would cool. The Fed just lost its “disinflation is working” narrative.
- Mexico — 3.45% (up from 3.26%): Creeping higher and now at the highest since May. Banxico has been cutting rates but this print may give them pause.
- Germany — 3.3% (up from 2.9%): The highest reading this year for Europe’s largest economy. Energy prices are the main driver, and the industrial base is feeling the squeeze from both sides — higher input costs and soft global demand.
- United Kingdom — 3.1% (August, up from 2.9%): Services inflation remains sticky at 3.4%, the BoE’s biggest headache. September data is still pending.
- Canada — 3.0% (August, flat): Holding steady month-over-month. September’s reading drops October 19 and could break either way.
- South Korea — 2.9% (down from 3.1%): The only partner where inflation actually declined. The Bank of Korea’s earlier tightening is showing results. Still above the 2% target, but moving in the right direction.
- Japan — 1.9% (August, flat): Looks calm on the surface. But Tokyo’s core CPI — a leading indicator for the national figure — jumped to 2.7% in September from 1.8%. The BOJ’s October meeting just got more interesting.
- China — 0.9% (slightly up): Still barely registering on the inflation thermometer. Producer prices, however, surged 5% — the fastest since 2022 — signaling that factory-gate costs are rising even if consumers aren’t feeling it yet.
The Big Movers
Three stories stand out this month:
India is on fire. A 71-basis-point monthly jump is the kind of move that sets off alarm bells in Mumbai. Food inflation at 7.74% hits the population hard in a country where food consumes roughly 40% of the average household budget. The RBI has been cutting rates, but that playbook may not survive another month of these numbers.
The US energy shock is real. Gasoline prices rose 9.1% in a single month and are up 34.2% year-over-year. That’s not a blip — that’s the kind of sustained energy inflation that feeds into everything from shipping costs to consumer expectations. Core inflation also ticked up, which means it’s not just energy. The PPI jumped 1.3% monthly (6.3% annually), suggesting more pipeline pressure ahead.
Japan is quietly brewing. The national CPI looks tame at 1.9%, but Tokyo’s leading indicator spiked to 2.7%. If that carries through to the national reading on October 22, the BOJ faces a genuine policy dilemma — hike into a fragile economy or let inflation run above target.
Trade Competitiveness: The Inflation Differential
Here’s where the rubber meets the road for businesses that import and export. When US inflation runs 2.8 percentage points above China’s and 1.8 points above Japan’s, the real effective exchange rate of the dollar appreciates — even if the nominal rate doesn’t move. American goods get more expensive relative to Asian alternatives, purely through the inflation channel.
The US-China gap of 2.8 points is particularly striking. Chinese factories are seeing producer prices surge (up 5%), but that cost pressure isn’t reaching consumers — it’s being absorbed by squeezed margins. That means Chinese export prices can stay competitive even as input costs rise, prolonging the pricing advantage against US manufacturers.
Meanwhile, the US-Mexico differential has narrowed to just 25 basis points (3.70% vs 3.45%). Near-parity inflation between the two countries neutralizes one of the traditional advantages of nearshoring production to Mexico — stable relative costs. If Mexican inflation accelerates further, that advantage erodes entirely.
What It Means for the Dollar and the Fed
The September CPI print complicates the Fed’s October meeting in two ways. First, headline inflation at 3.7% with core ticking up to 2.6% makes a rate cut politically indefensible — especially with PPI running hot at 6.3% year-over-year. Second, import prices are up 8.1% annually, which means the inflation we’re importing isn’t helping either.
But here’s the catch: higher US rates relative to trading partners strengthen the dollar, which makes imports cheaper and exports more expensive. It’s a self-correcting mechanism — but a slow and painful one. US manufacturers competing with Chinese, Japanese, and Korean producers are fighting on two fronts: higher domestic input costs and a stronger currency.
Bottom Line
September was an energy-driven inflation month almost everywhere that matters. The US, India, and Germany all saw meaningful accelerations, while South Korea was the lone bright spot with a genuine deceleration. China remains the deflationary anchor pulling global averages down, but with producer prices surging, that anchor may not hold much longer.
For American businesses: the inflation differential with Asia is widening in the wrong direction. For the Fed: October is almost certainly a hold. For the rest of us: buckle up — energy prices don’t look like they’re coming down anytime soon, and October’s data drops for Canada (19th), Japan (22nd), and the UK will either confirm or complicate this picture.
Sources: US Bureau of Labor Statistics, INEGI (Mexico), Statistics Canada, National Bureau of Statistics of China, Statistics Bureau of Japan, Destatis (Germany), KOSTAT (South Korea), UK Office for National Statistics, Ministry of Statistics and Programme Implementation (India). Data as of October 16, 2026.