We’ve been playing around with graphs and charts using data from previous stock market crashes. Here’s what we think *might* happen to the SPY and QQQ over the next 16 months. The following charts show the drop from the peak down to the bottom. The chart below is measured in trading days but the timeline from peak to low is in calendar days.
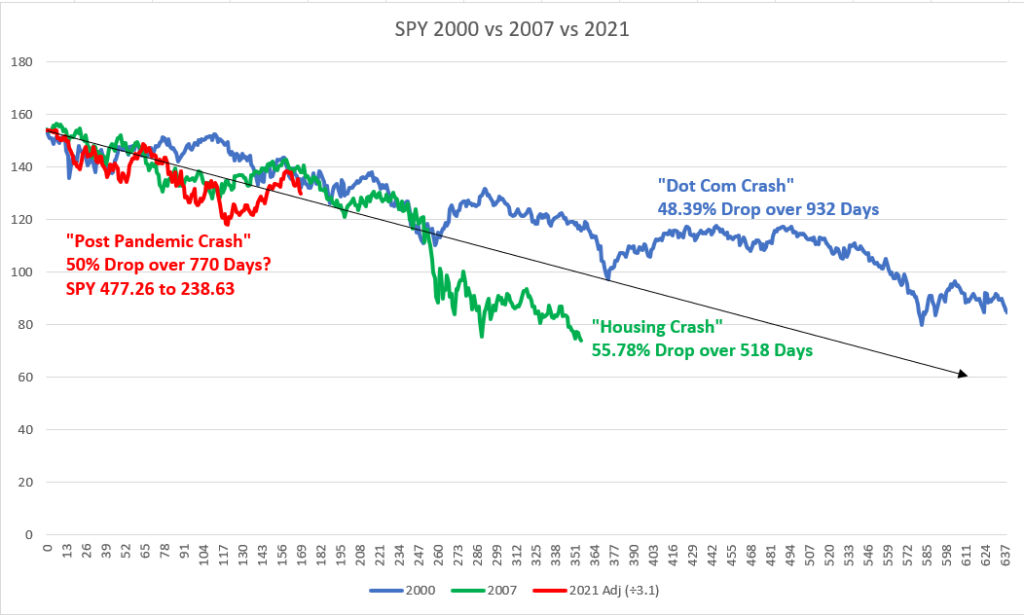
The SPY has had two big crashes this century. In 2000, known as the “dot com” crash, we saw the SPY drop 48.39 percent over 932 days. The “housing” crash had SPY drop 55.78 percent over 518 days. Both of these crashes were caused by financial malfeasance in the stock market ecosystem. If prior crashes hold then we think it could take up to 770 days for SPY to bottom 50% all the way down to 238.63 and we are already 245 calendar days from the last peak on 12/27/2021 so we may have 525 calendar days to go for SPY to hit bottom? If so that would be in February 2024.
Let’s take a look at QQQ:
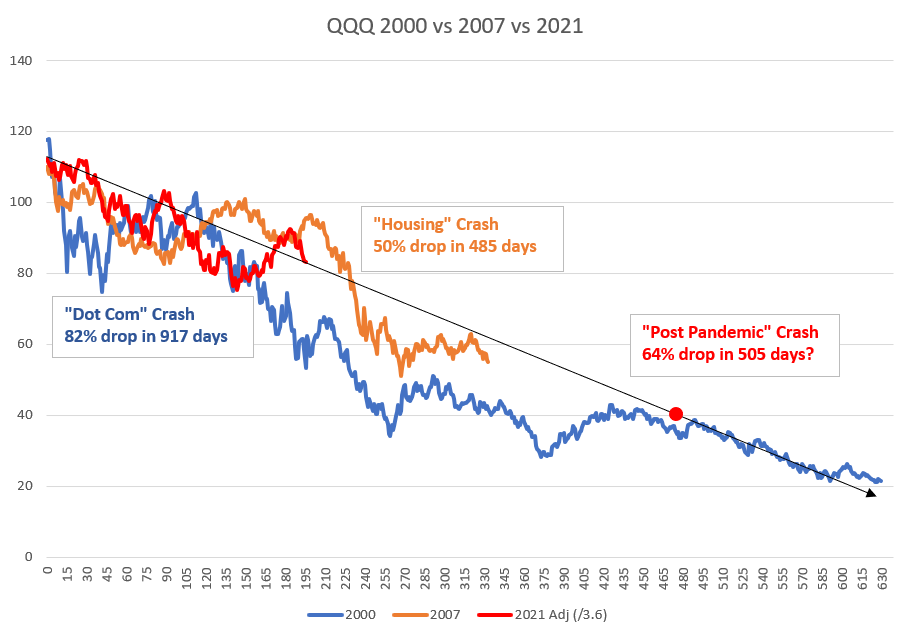
Like the SPY, QQQ has had two big “crashes” this century. The first, dot com crash, dropped QQQ a whopping 82% from highs over 917 calendar days. The “housing” crash dropped QQQ 50% over 485 calendar days. If we use the prior two crashes to hypothesize about a third crash then we would expect QQQ to drop 64% over 505 calendar days to 258.55. We are already 285 days past from the peak on 11/19/21 so that leaves 485 calendar days to go which would target Dec 30, 2023.
What is different *this time* from the prior two crashes is that the Federal Reserve is fighting rampant inflation whereas the last two crashes, inflation wasn’t as big an issue as it is today. The global geo-political issues from energy shortages, supply chain disruptions, labor shortages and other factors will make it impossible for the Federal Reserve to use lowering interest rates to stimulate the economy without causing inflation to explode exponentially.
We therefore think this crash may be harder and happen faster than prior crashes but the opposite is also possible, the crash may take 917 days similar to the dot com crash. In either event, we do expect SPY and QQQ to decline over the next 16 months until the global situation normalizes.
We are exploring buying puts on SPY and QQQ and may wait for a rally to acquire puts as the put values generally drop during rallies. Ironically, we anticipate SPY and QQQ lows to be around 239 & 258 mark and the convergence point seems to be around January 2024. We’ll keep you posted.
In the meantime, stay tuned and stay solvent…
[…] Predicting The Post Pandemic Stock Market Crash, we took a look at past stock market crashes trying to figure out where we are headed next. We also […]