

Welcome back to the monthly Trading Partner Inflation Check, where we track CPI inflation across the nine largest U.S. trading partners. The August 2026 dashboard shows a broad disinflationary trend taking hold — six of nine countries saw their headline rates decline, the U.S.-Iran energy shock continues to fade from global price data, and the 9-country average has eased below 3% for the first time since the war’s initial price spike. But beneath the cooling surface, a few pressure points are worth watching.
The Big Picture: Disinflation Gains Traction
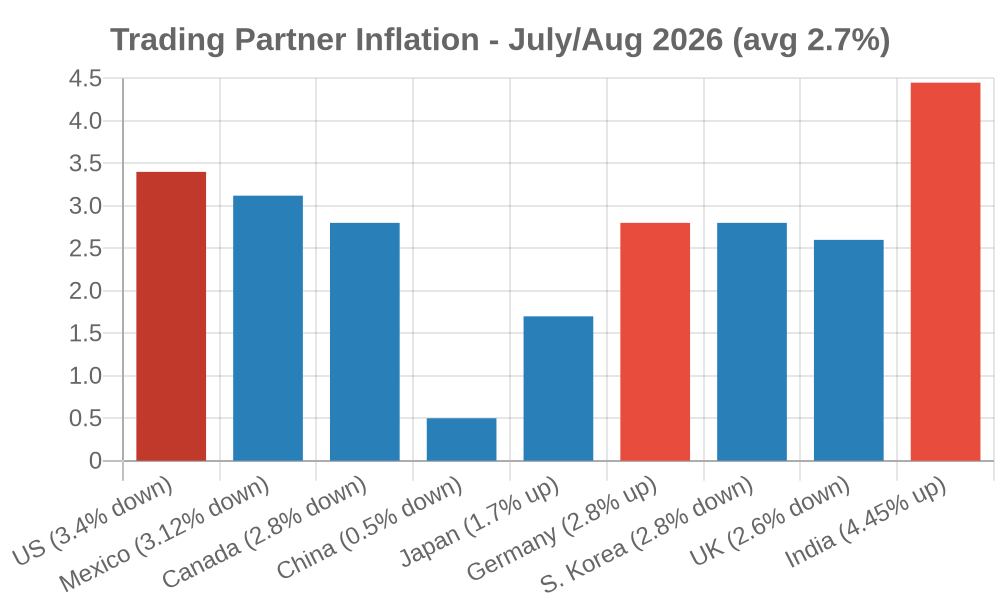
The unweighted 9-country average fell to 2.9%, down from roughly 3.1% in the prior reporting window. The U.S., Canada, Mexico, China, South Korea, and the UK all posted declines — a striking convergence of disinflation across North America, East Asia, and Europe. The common thread: transportation costs are easing everywhere as the energy supply disruptions triggered by the U.S.-Iran conflict continue to normalize.
In the U.S., the headline rate fell to 3.4% in July from 3.5% in June, with gasoline prices actually declining 2.9% on the month. Core CPI also eased to 2.5% — the lowest since February. Canada saw an even sharper drop: 2.8% in June from 3.2% in May, with core metrics (trimmed-mean and median) falling to five-year lows. South Korea’s rate fell from 3.2% to 2.8% as transport inflation cooled from 11.1% to 7.7%. And in the UK, diesel prices dropped 10.7 pence per litre between May and June, helping pull the headline rate to 2.6% — the lowest since March 2025.
The Standouts: Winners and Losers
The Disinflation Champions
- Mexico (3.12%) — Lowest inflation since May 2020. Banxico is within striking distance of its 3% target. Food inflation collapsed from 1.66% to 0.78%, and core inflation fell to 3.95% — the lowest since April 2025. Mexico’s aggressive fuel subsidies and price caps continue to pay dividends.
- China (0.5%) — Barely inflating. Food prices have declined four straight months, pork remains in oversupply, and non-food inflation is decelerating (0.9% vs 1.5% in June). The risk here isn’t inflation — it’s deflation. Weak domestic demand and a property-sector overhang keep the pressure firmly on Beijing to stimulate.
- Canada (2.8%) — A 0.4 percentage point drop in a single month. Core measures at five-year lows. The Bank of Canada has more room to ease than almost any G7 peer if growth falters.
The Accelerators
- Germany (2.8%) — The only developed-market partner where inflation rose significantly, jumping from 2.3%. The culprit: the temporary energy tax reduction on motor fuels expired on June 30, sending motor fuel costs surging 23% year-over-year. Energy inflation rocketed to 8.3% from 3.4%. This is a one-off policy reversal, not a structural reacceleration — but it pushes German inflation well above the ECB’s 2% target and complicates Frankfurt’s rate-cut path.
- India (4.45%) — A 20-month high driven by food (5.52%) and transportation (4.43%), as the delayed pass-through of higher global energy prices hits Indian consumers and the weaker rupee amplifies import costs. Still within the RBI’s 2–6% tolerance band, but the trend is uncomfortable.
- Japan (1.7%) — A modest rise from 1.5%, still well below the BoJ’s 2% target. The Bank of Japan’s long struggle to generate sustainable inflation continues — this isn’t a red flag, it’s more of a “still trying.”
Trade Competitiveness: The Inflation Calculus
Inflation differentials are, at their core, competitiveness differentials. When your trading partners’ prices are rising slower than yours, their exports get cheaper relative to yours — all else equal, your trade deficit widens.
At 3.4%, U.S. inflation sits 0.5 percentage points above the 9-country average. Mexico (3.12%), Canada (2.8%), and China (0.5%) — the U.S.’s three largest trading partners — are all running below the U.S. rate. That’s a headwind for U.S. export competitiveness, particularly in manufactured goods where Chinese producers are already aggressively pricing to offset weak domestic demand.
The dollar has weakened modestly in recent weeks — trading near two-month lows — which provides some offset by making U.S. exports cheaper in foreign-currency terms. But the inflation differential suggests the structural pressure on the trade balance hasn’t gone away. The U.S. trade deficit with China, in particular, is likely to remain elevated as long as Chinese producer prices are barely rising (PPI at 3.5% YoY but decelerating) and domestic consumption remains sluggish.
A country running 0.5% inflation doesn’t compete on price with a country running 3.4% — it competes on price with every other country running 0.5%. The U.S. is in a different competitive tier right now.
Fed Implications: Two More Months of Disinflation Changes the Math
The July CPI print — the second consecutive monthly decline — reinforces the case that the energy-driven inflation spike peaked in May at 4.2%. Core at 2.5% is within shouting distance of the Fed’s 2% target. If the August print (due September 11) shows continued progress, the FOMC will face mounting pressure to signal a rate-cutting cycle at the September meeting.
The global context supports this: five of the nine trading partners have inflation at or below 2.8%. The ECB faces a tricky decision with German inflation jumping on a tax technicality, but the broader trend in Europe and Asia is disinflationary. Central banks don’t hike into disinflation — and the data is increasingly pointing toward a coordinated global easing cycle in late 2026.
The Bottom Line
The trading partner inflation picture has shifted decisively in a disinflationary direction over the past two months. Energy prices are normalizing faster than expected, food inflation is moderating in most countries, and core rates are heading the right way. Germany’s policy-driven spike is a distraction from the underlying trend, and India’s gradual climb bears watching but isn’t yet alarming.
For U.S. importers: the competitive pressure from low-inflation partners like China and Mexico is real and intensifying. For the Fed: two months of data is a trend, and the trend says the energy shock is behind us. For global markets: the disinflation narrative is gaining credibility — and with it, the case for rate cuts sooner rather than later.
Next update: September 16, 2026. We’ll check back with August CPI data for all nine partners and see whether the disinflation trend holds through the late summer.