As we mentioned in our post, Algebra and the Post Pandemic Crash, we like to take a look at investment opportunities through different perspectives. Our data feeds from a variety of sources all tell us that everyone is now talking about a housing crash or housing correction so we wanted to know how we might be able to profit from this growing expectations.
We looked at an ETF which represents most housing related companies, XHB, and we took a look at a variety of data sets including peaks and troughs and came up with the following graph.
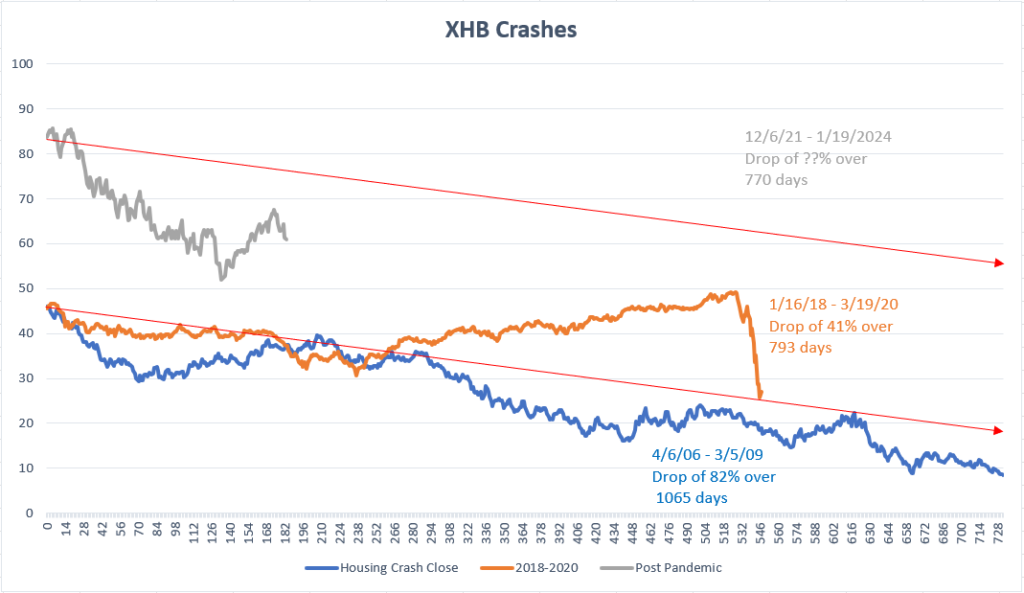
XHB has had a few corrections or crashes over the years. The first peak to trough cycle was the “housing crash” which had XHB peaking on 4/6/2006 reaching a high of $46.02 then hit a low on 3/5/2009 at $8.44 and that descent took 1065 days.
The second peak/trough cycle began 1/16/2018 where XHB peaked at $45.67 then dropped to $26.99 caused by the pandemic and that journey took 793 days.
We attempted to “thread the needle” and created a line that would show the slopes for both of the XHB drops then created a parallel thread to guesstimate where XHB could be headed if there is indeed a housing crash.
With the Federal Reserve aggressively hiking interest rates, it is entirely possible that a correction or crash happens sooner but housing has become so over valued over the past two years that we think it will take at least two years to wind down.
We chose 1/19/2024 because that’s as far out as current options are traded and it seems to match our plausible analysis of where XHB may drop.
With all of this data in mind, we decided to test the water and purchased some PUTS at $55 strike for January 19, 2024 expiry for about $6 per contract. This means that we won’t make money unless XHB trades below $49 on or before January 19, 2024.
Stay tuned and stay solvent…
[…] Back in August, we wrote How To Profit from a Housing Correction/Crash and followed that up with Time To Profit From A Housing Crash and today we’re taking one more look at XHB through the Fed Funds Rate […]