

The Social Security Administration’s latest monthly snapshot — covering April 2026 — confirms what every budget watcher already suspects: the program is growing faster than ever. Total monthly benefits have reached $137.4 billion, annualizing to a staggering $1.65 trillion. That’s up from $130.9 billion just seven months ago in September 2025. The beneficiary count? Now 71.08 million Americans, climbing by roughly 115,000 new enrollees every single month.
This isn’t a surprise. It’s math. The leading edge of the Baby Boomer generation turned 80 this year, while the trailing edge is still crossing 65. The demographic wave that economists have warned about for decades is no longer approaching — it has arrived.
The Numbers: April 2026 Snapshot
- Total beneficiaries: 71,077,000 — up 116,000 from March, up 882,000 year-over-year from June 2025
- Total monthly benefits paid: $137.377 billion — up $420 million from March, up $7.5 billion from June 2025
- Average monthly benefit: $1,932.80 — retired workers average $2,081.16
- Annualized run rate: $1.648 trillion — roughly 5.8% of projected 2026 GDP
Break it down by program: Old-Age and Survivors Insurance (OASI) covers 62.99 million people at a cost of $125.3 billion per month. Disability Insurance (DI) adds another 8.08 million beneficiaries and $12.1 billion. Retired workers alone — 54.3 million of them — collect $113 billion monthly, at an average check of $2,081.
The Trajectory: 11 Months of Uninterrupted Growth
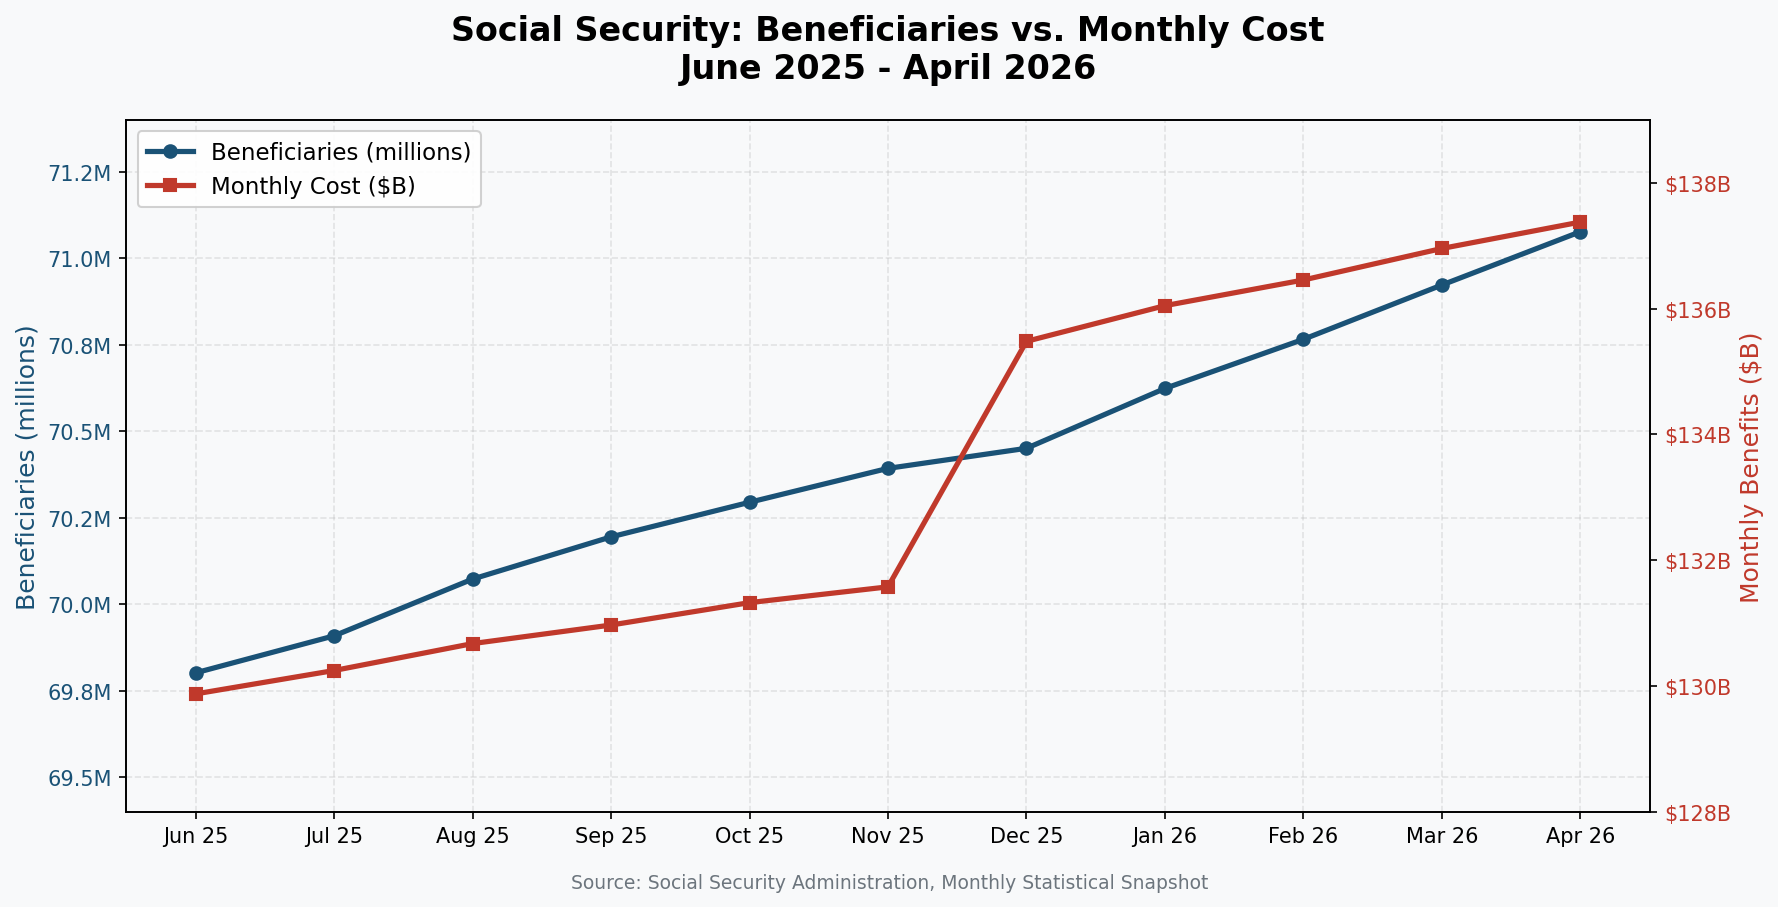
The chart tells a clean story: both lines slope upward together, relentlessly. Beneficiary growth is a straight march — 69.8 million in June to 71.1 million in April, roughly 80,000–116,000 new recipients per month. The monthly cost line shows a sharper inflection in December 2025, when the 2026 COLA kicked in with a 2.5% bump plus higher-earning new entrants replacing older, lower-benefit recipients.
The COLA Effect and What It Means
The December-to-January jump in monthly benefits — from $135.5 billion to $136.0 billion — reflects the 2026 cost-of-living adjustment. But the real story is in the compounding: the average retired worker benefit now sits at $2,081.16, up from $2,005.05 in June 2025. That’s a 3.8% annual increase, outpacing the 2.5% COLA. The reason? Higher-wage workers retiring and replacing lower-benefit deceased beneficiaries continually pushes the average upward, independent of the inflation adjustment.
The Demographic Math Is Unforgiving
At the current growth rate — roughly 882,000 new beneficiaries per year — Social Security will cross 72 million recipients by late 2026 and 75 million before 2030. The Boomer wave crests around then, but the cost doesn’t crest with it. These are lifetime obligations, indexed to inflation, funded by a worker-to-beneficiary ratio that keeps shrinking.
The 2025 Social Security Trustees Report projected trust fund depletion by 2035. That projection assumed certain economic conditions — moderate growth, contained inflation, steady labor participation. None of which are guaranteed in a world with 6.5% PPI and an active Iran conflict driving energy costs higher. A recession that reduces payroll tax revenue while simultaneously pushing early retirements could accelerate the timeline significantly.
What Investors Should Watch
- Treasury issuance: Every dollar of Social Security shortfall becomes a dollar of Treasury debt. The $1.65 trillion annual run rate will only grow — and it competes with everything else the government borrows for.
- Labor force participation: The worker-to-beneficiary ratio drives solvency math. Watch prime-age participation rates and immigration policy — both affect the denominator.
- Inflation sensitivity: Higher CPI means higher COLAs means faster benefit growth. In an inflationary environment, Social Security costs accelerate on both axes — more people plus bigger checks.
- Political risk: The 2028 election cycle will coincide with the depletion timeline becoming a front-page issue. Expect means-testing proposals, benefit-cut discussions, and payroll-tax-hike debates.
The September snapshot last year showed a $130.97 billion monthly cost and 74 million total SSA beneficiaries (including SSI). Seven months later, that’s $137.38 billion and 75.5 million. At this pace, by the time the next snapshot drops in June, we’ll be looking at $138 billion and 71.2 million — and the conversation about funding America’s largest entitlement program will only get harder to ignore.
Source: Social Security Administration, Monthly Statistical Snapshot, April 2026 (released May 2026). Historical data from SSA snapshots June 2025–March 2026.