
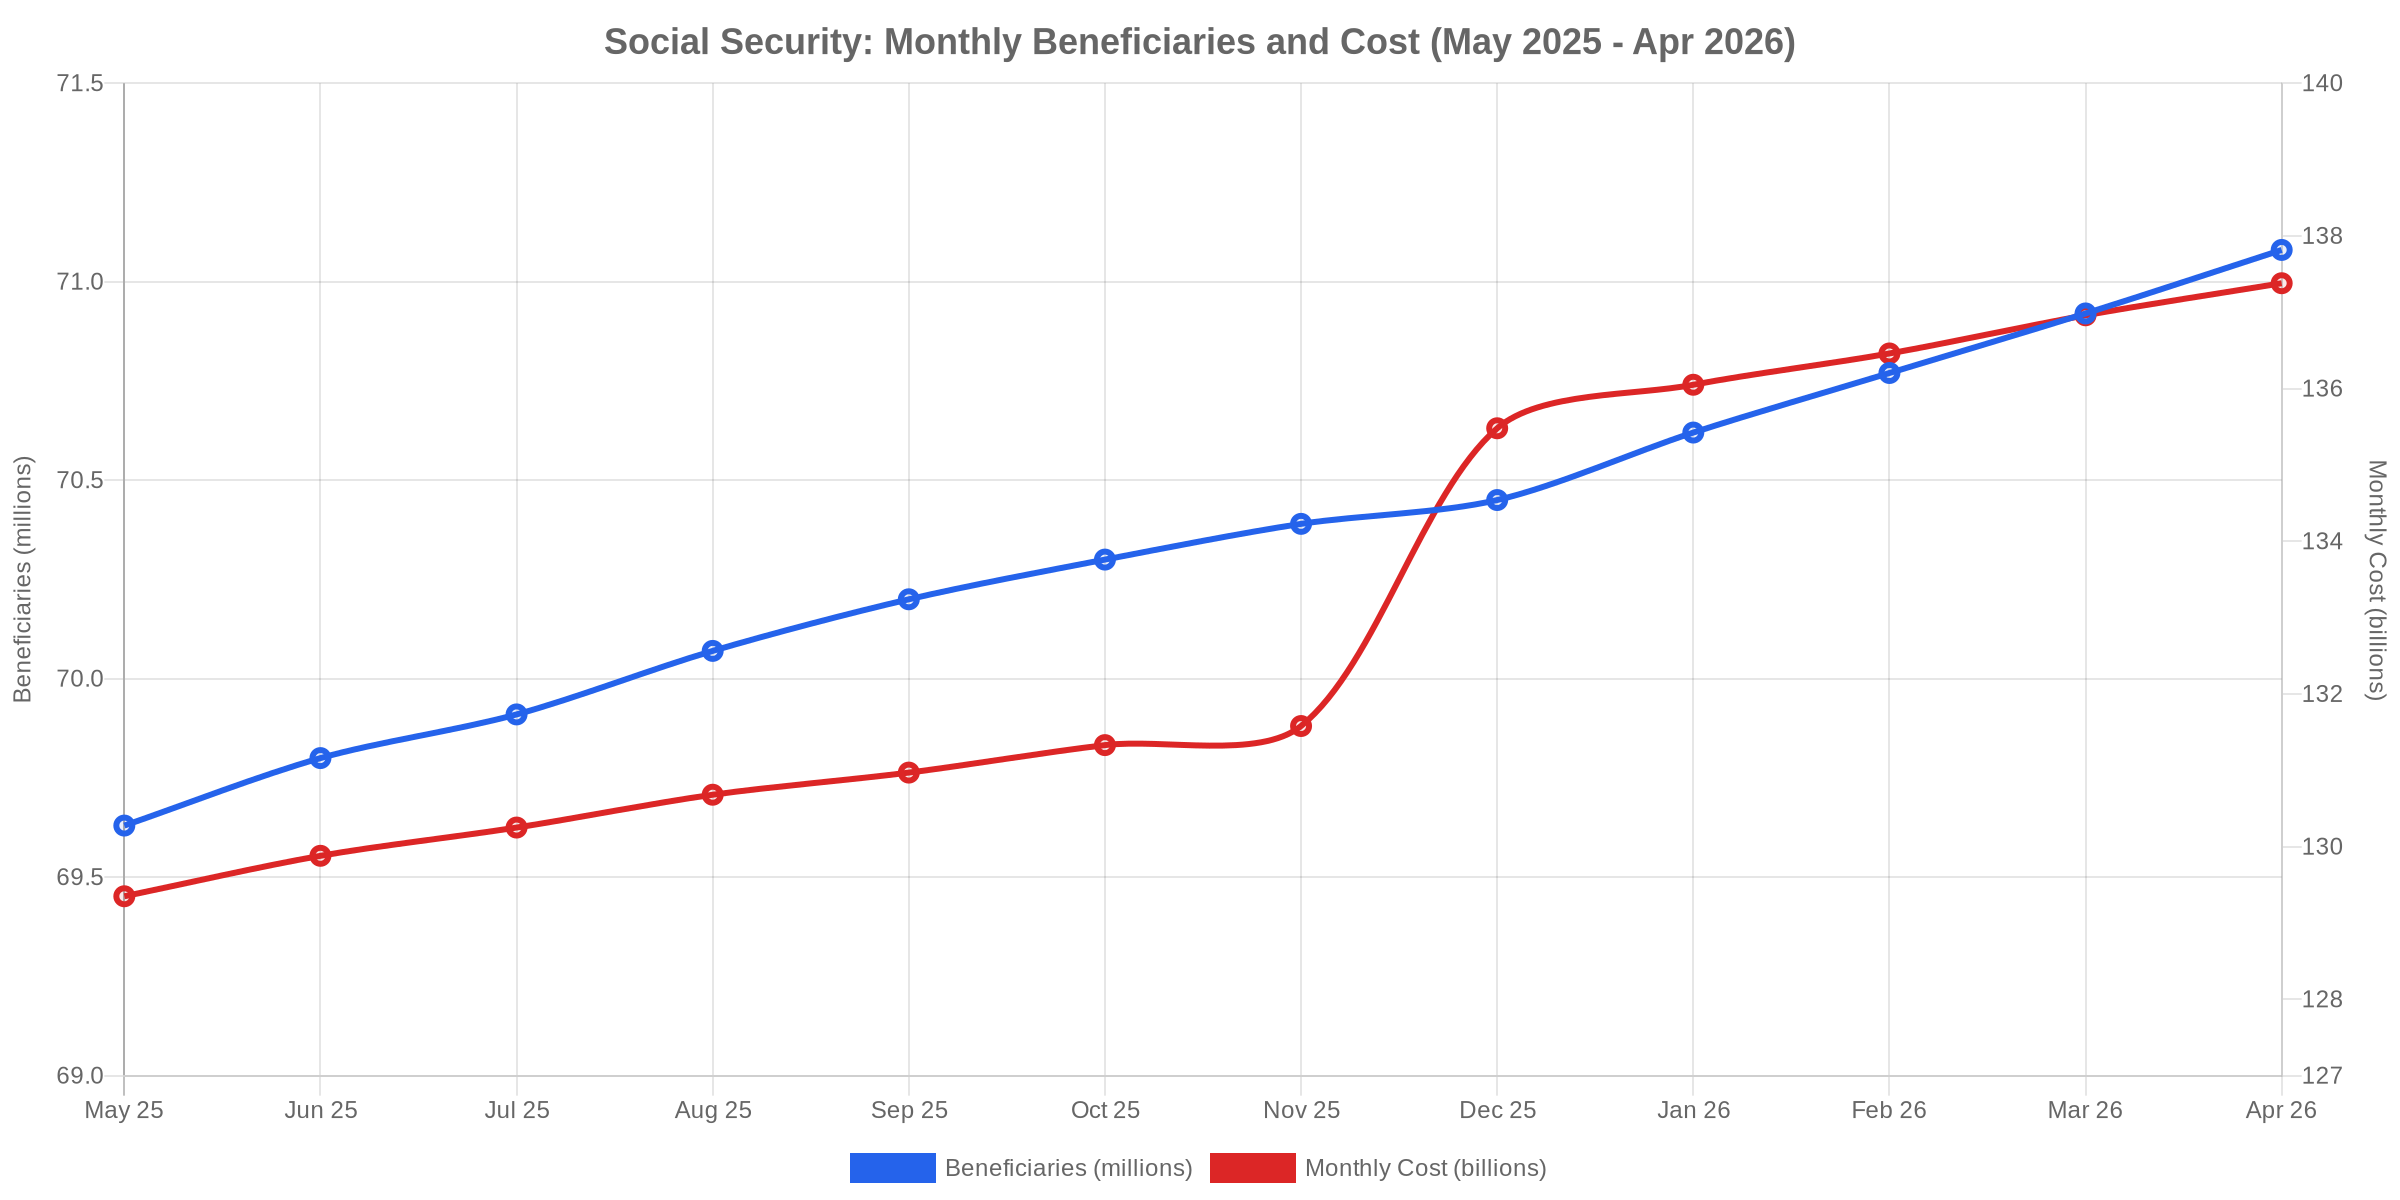
The Social Security Administration’s April 2026 snapshot, released in May, marks a fresh milestone: 71.08 million Americans now receive benefits, and the monthly tab has climbed to $137.4 billion. That’s an annualized run rate of $1.65 trillion — roughly 5.8% of projected GDP — and the program shows no sign of slowing down.
- Total beneficiaries: 71,077,000 — up 154,000 from March, adding roughly 120,000 recipients per month over the trailing twelve
- Total monthly benefits paid: $137.377 billion — up $420 million from March
- Average monthly benefit: $1,932.80 across all categories; retired workers average $2,081.16
- Year-over-year cost growth: $8.0 billion/month above May 2025 ($129.4B), a 6.2% increase
- Twelve-month enrollment growth: +1.45 million beneficiaries since May 2025
OASI and DI: The Breakdown
Old-Age and Survivors Insurance (OASI) dominates the ledger. Of the 71.08 million total, 62.99 million fall under OASI — 88.6% of the rolls — collecting $125.3 billion per month. The retiree core alone is staggering: 54.3 million retired workers draw $113 billion monthly, an average check of $2,081. Spouses and children of retired workers add another 2.8 million recipients and $2.8 billion to the monthly outflow.
Disability Insurance (DI) covers 8.08 million Americans at $12.1 billion per month. Disabled workers receive an average of $1,634.70 — roughly 78% of what retirees get — reflecting the earnings-history formulas that drive benefit calculations. The DI rolls have actually shrunk slightly over the past year (from 8.22 million last May), a rare bright spot driven by an aging DI population converting to retirement benefits at full retirement age.
Survivor benefits — covering widows, widowers, and children of deceased workers — account for 5.85 million recipients and $9.5 billion monthly. Nondisabled widows and widowers make up the bulk: 3.51 million people averaging $1,928 per month.
The COLA Effect and Real Growth
The 2.5% cost-of-living adjustment (COLA) hit checks in December 2025, and the chart below makes the step-change unmistakable. From November to December, monthly outlays jumped by $3.9 billion — a mix of the COLA bump and the ongoing wave of new retirees replacing deceased, lower-benefit recipients.
But here’s the subtler story: even after the COLA settled in, growth kept accelerating. From January to April 2026, monthly costs rose another $1.33 billion — and that’s pure enrollment and wage-replacement math, not COLAs. The average retired-worker benefit climbed from $2,005 in June 2025 to $2,081 today, a 3.8% increase that outpaces the 2.5% COLA. Why? Because new retirees enter the system with higher earnings histories than those who pass away. Every replacement tilts the average upward.
Demographic Math Is Relentless
“The baby boomer retirement wave isn’t a future event economists are still warning about. It’s the water we’re all swimming in right now.”
At the current pace — adding roughly 121,000 beneficiaries per month, or 1.45 million per year — total enrollment crosses 72 million before the end of 2026 and 75 million before 2030. The worker-to-beneficiary ratio, the program’s solvency linchpin, stands at roughly 2.5 workers per recipient and drifts lower every month.
April alone added 154,000 net new beneficiaries — the second-largest monthly gain in the twelve-month series. That’s well above the 120,000 trailing average and worth watching if it becomes a trend.
What Investors Should Track
- Treasury issuance pressure: Every dollar of Social Security shortfall becomes Treasury debt. At $1.65 trillion annually — and growing — the program’s funding gap competes with everything else the government borrows for.
- Labor force participation: The worker-to-beneficiary ratio is the program’s single most important variable. Watch prime-age (25–54) participation rates and immigration policy — both directly affect payroll tax revenue.
- Inflation sensitivity: CPI-W determines the annual COLA. In an inflationary environment, Social Security costs accelerate on both axes — more people plus bigger checks. The April CPI print feeds directly into October’s COLA announcement.
- 2028 political risk: The 2025 Trustees Report projects trust fund depletion by 2035. That places the next presidential election squarely in the “serious conversation” zone — expect proposals on means-testing, benefit formulas, and payroll tax caps to surface well before primary season.
What to Watch Next Month
The May 2026 snapshot (released in June) will tell us whether April’s elevated +154,000 enrollment bump was noise or the start of an accelerating trend. Also watch: average benefits. If the replacement-rate effect continues pushing average checks above the COLA rate, the annualized cost climbs faster than the simple inflation-plus-enrollment math suggests.
The broader question — the one that matters for bond markets, equity allocations, and fiscal policy — is not whether Social Security grows. It does that every month. The question is when the growth rate itself begins to accelerate as the trailing edge of the baby boom crosses into eligibility and the leading edge lives longer than actuarial tables predicted.
Source: Social Security Administration, Monthly Statistical Snapshot, April 2026 (released May 2026). Historical comparison data from SSA snapshots May 2025–March 2026.